Quick Summary
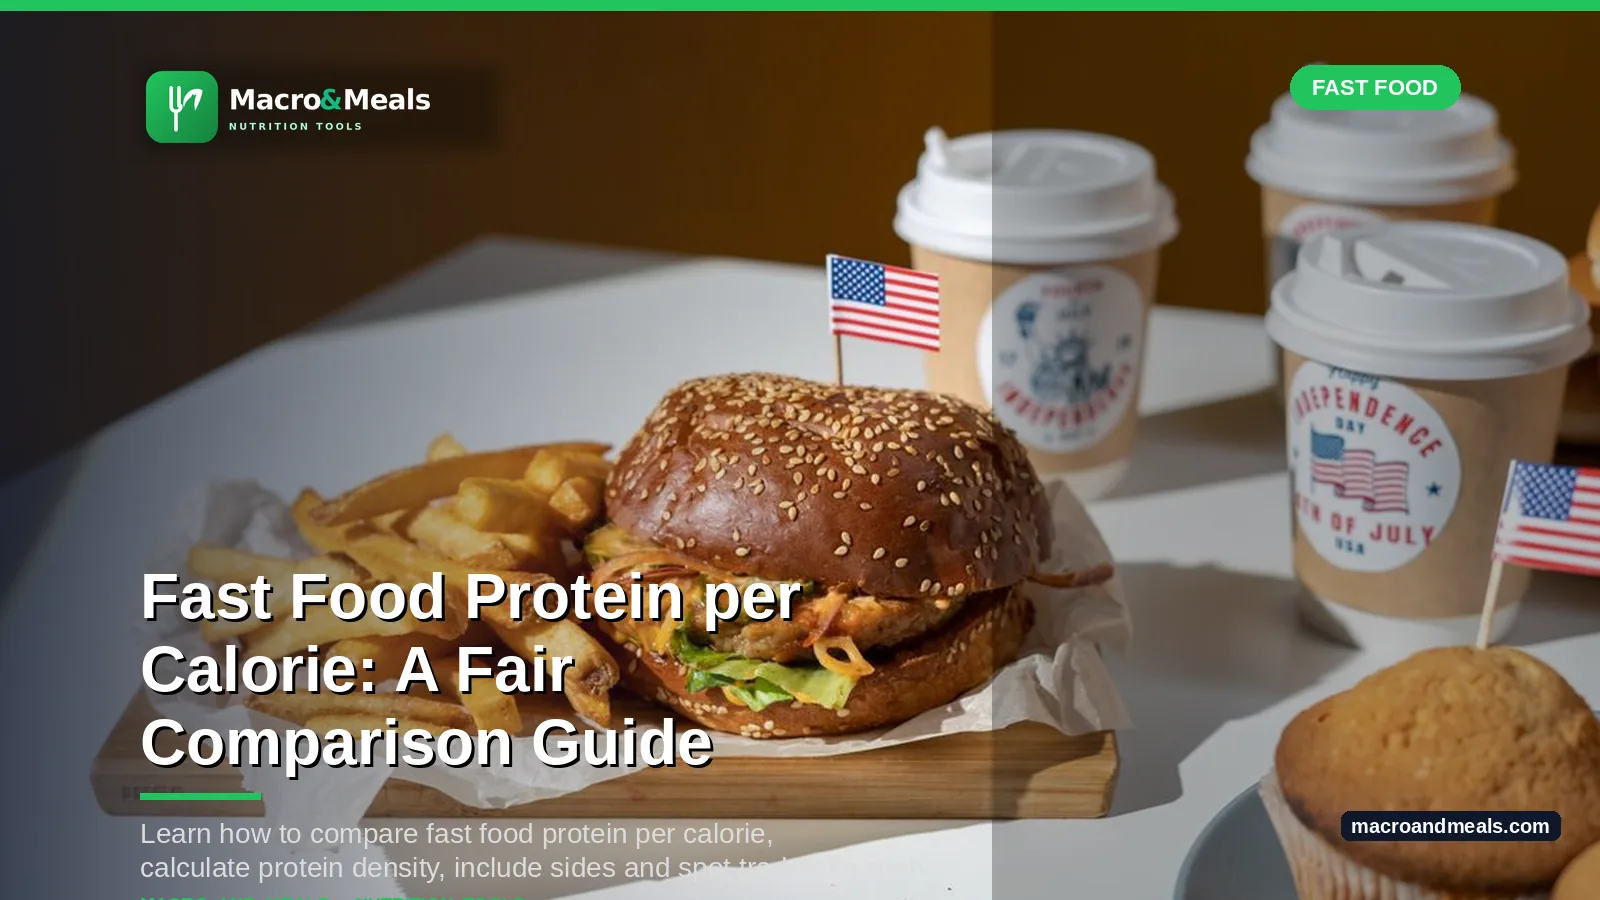
1. The short answer: Protein density = (protein grams ÷ calories) × 100.
2. Also covered: Which fast food has the most protein for its calories?
3. Also covered: Why the metric is useful
4. Also covered: A calculator you can understand
Table of Contents
1. Which fast food has the most protein for its calories?
There is no reliable single winner without deciding which menu items, serving sizes and customizations you are comparing. A plain chicken entrée, a wrap with sauce and a large combo meal are very different purchases. The phrase "most protein per calorie" can make a useful comparison, but it does not mean the highest-scoring food is automatically the best meal for your needs.
A transparent way to compare restaurant choices is to calculate grams of protein per 100 calories:
Protein density = (protein grams ÷ calories) × 100.
For example, if an illustrative item has 30 grams of protein and 300 calories, it supplies 10 grams of protein per 100 calories. That calculation is arithmetic, not a claim about a particular restaurant item. You should never transfer those numbers onto a named product without checking its posted nutrition.
2. Why the metric is useful
Suppose you are deciding between two different menu items and protein is one priority. Calories alone tell you nothing about protein, while protein grams alone do not account for total energy. A ratio can help compare how efficiently different menu items provide protein in relation to calories.
But the metric has limits. It does not measure fiber, fruit or vegetables, sodium, saturated fat, price or taste. And it can make a small snack appear impressive even when it would not be a complete lunch.
A good comparison shows both the ratio and the real numbers:
| Field | What readers need to see |
|---|---|
| Restaurant and item | Exact current menu name |
| Serving | Standard size and preparation |
| Calories | Official posted value |
| Protein | Official posted grams |
| Protein per 100 calories | Recalculated from those two values |
| Fiber, sodium, saturated fat | Where officially available |
| Customizations | Precisely what was changed |
| Verification date | The day the facts were checked |
If even one of the two values used in the ratio is missing, mark that entry as unranked. Do not put a guessed number into a scientific-looking table.
3. A calculator you can understand
You do not need a complicated formula or a proprietary score. Imagine two fictional example meals:
- Meal A: 24 grams of protein, 400 calories. Protein density is 6 grams per 100 calories.
- Meal B: 31 grams of protein, 620 calories. Protein density is 5 grams per 100 calories.
Meal A scores higher for protein density even though Meal B contains more total protein. If you need a larger meal, Meal B might still fit your needs. The ratio answers only one question: how much protein is delivered relative to the calories listed.
The same caution applies to drinks. A high-protein coffee may have a strong ratio but does not necessarily replace a meal with vegetables or fiber.
4. The sides change the answer
A common mistake is to rate the main item and then describe the whole order as though it had the same ratio. Add chips, fries, a sweetened drink or dessert, and the total calories and sometimes protein change. Even an extra protein portion changes the numbers.
Calculate an order as a whole:
Order calories = sum of calories in every selected component. Order protein = sum of protein in every selected component.
Then run the ratio on those totals. Keep the source and serving sizes attached to each component. When the restaurant supplies a finished meal's nutrition, use that posted value rather than combining separate numbers that might double count ingredients.
5. What Chipotle illustrates
Chipotle's ordering interface lists customizable ingredients, which makes it easy to see how components can change an order. A standard rice serving is currently listed at 210 calories, a standard bean serving at 130 calories, and fajita vegetables at 20 calories on the US builder. These amounts are component values, not complete meal totals.
Chipotle also publishes complete high-protein menu configurations. When you compare a preset bowl against a manually customized order, confirm that both use the same market and currently available menu items. Presets may not use the exact combination you assume from their name.
To work through options you are considering, use the MacroAndMeals Chipotle nutrition calculator as a companion, but cross-check its entries against Chipotle's official calculator and current data.
6. Five mistakes to avoid when ranking fast food
- Ranking a single entrée beside a complete combo meal.
- Comparing US values with another country's menu without noticing.
- Treating an "extra protein" customization as the standard serving.
- Ranking foods with missing protein data as though it were zero.
- Ignoring sodium, fiber and the overall size of a meal.
You also cannot assume higher protein means lower calories. An entrée with cheese, sauces or an added side may provide more protein and more total energy at the same time.
7. How to choose without overthinking it
First, decide what matters to you. If you want more protein and already know the restaurant, compare a few realistic orders. If fiber is another priority, add it to your table. If sodium is important for your health, consider the complete information and seek qualified advice where appropriate. A ratio can narrow options, but it should never dictate a diet on its own.
It is also reasonable to choose a meal based on price, availability and whether you actually want to eat it. There is no benefit to producing a technical "best" order that a reader would never select.
8. The bottom line
Protein per 100 calories is a useful comparison tool, not a nutrition score that proves one meal is superior. Use dated official values, compare equivalent serving types, include the full order and show other important nutrients. A trustworthy leaderboard must publish its calculation method and each exact item used to make the ranking.
Sources
- Chipotle ordering interface.
- Chipotle nutrition calculator.
- FDA: How to Use the Nutrition Facts Label.
- USDA MyPlate: Protein Foods.
Check Chipotle Nutrition First
Use the free Chipotle calculator to build your order and see the totals before you go.